So You Think You’re Ready for an Enterprise Knowledge Graph?
We’ve all heard that “data is the new oil” or a similar analogy to describe the potential business value of enterprise information. But can that oil be found? According to a new Forrester report, the answer is likely not, seeing as employees lose 12 hours a week chasing data on average.
Can that data be leveraged? Forrester has the grim answer again: between 60 percent and 73 percent of all data within an enterprise goes unused for analytics.
While we’ve made impressive strides in IT to accomplish tasks at scale and speed (storage, compute, AI), we seem to have treated data as a by-product of these functions, without accounting for the need to re-use or share that data beyond its originating source system.
More specifically, we’ve treated data as a siloed by-product of the average 367 software apps and systems large organizations use to manage their workflows, none of which “speak the same language.”
As a result, we are left with sprawling, disconnected heterogeneous data sources that are potentially duplicated, out-of-date, inaccessible, and most likely never used.
It’s no surprise that “democratizing data across organizations” is on the top of most Chief Data Officers’ priority list, but how do we accomplish this at scale and without adding yet-another-data silo in the form of a fancy new data lake or warehouse?
Chief Data Officers and other professionals in the enterprise data management space are turning to knowledge graphs as the desired tool to connect disparate heterogeneous data assets across organizational disciplines. Gartner predicts that by 2025, graph technologies will be used in 80% of data and analytics innovations, up from 10% in 2021, facilitating rapid decision making across the organization.
What are knowledge graphs?
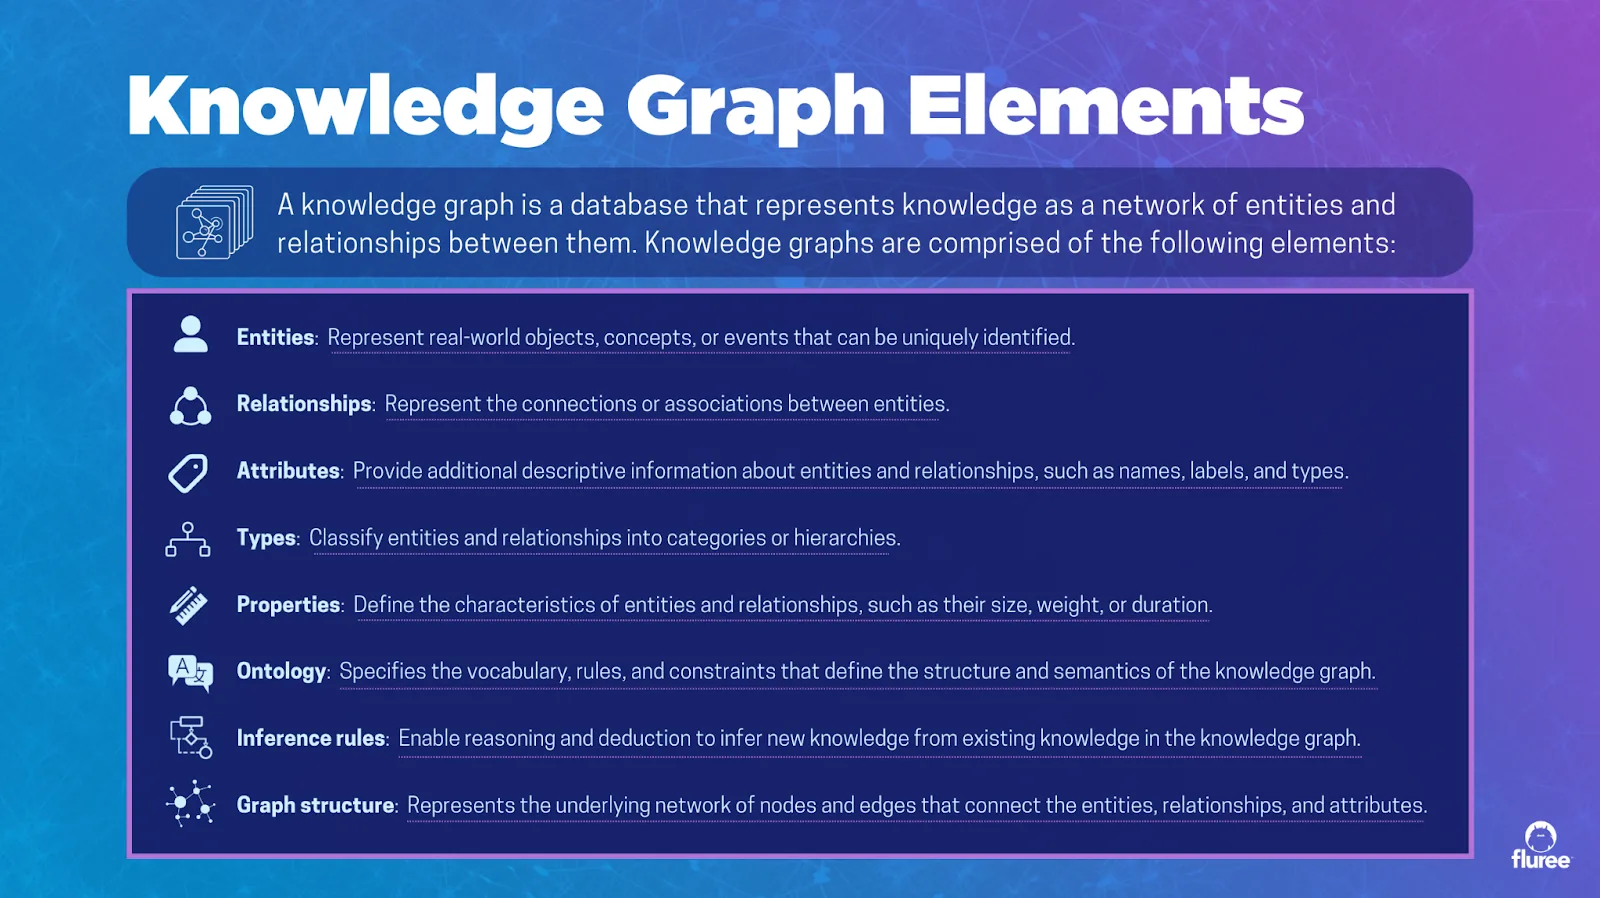
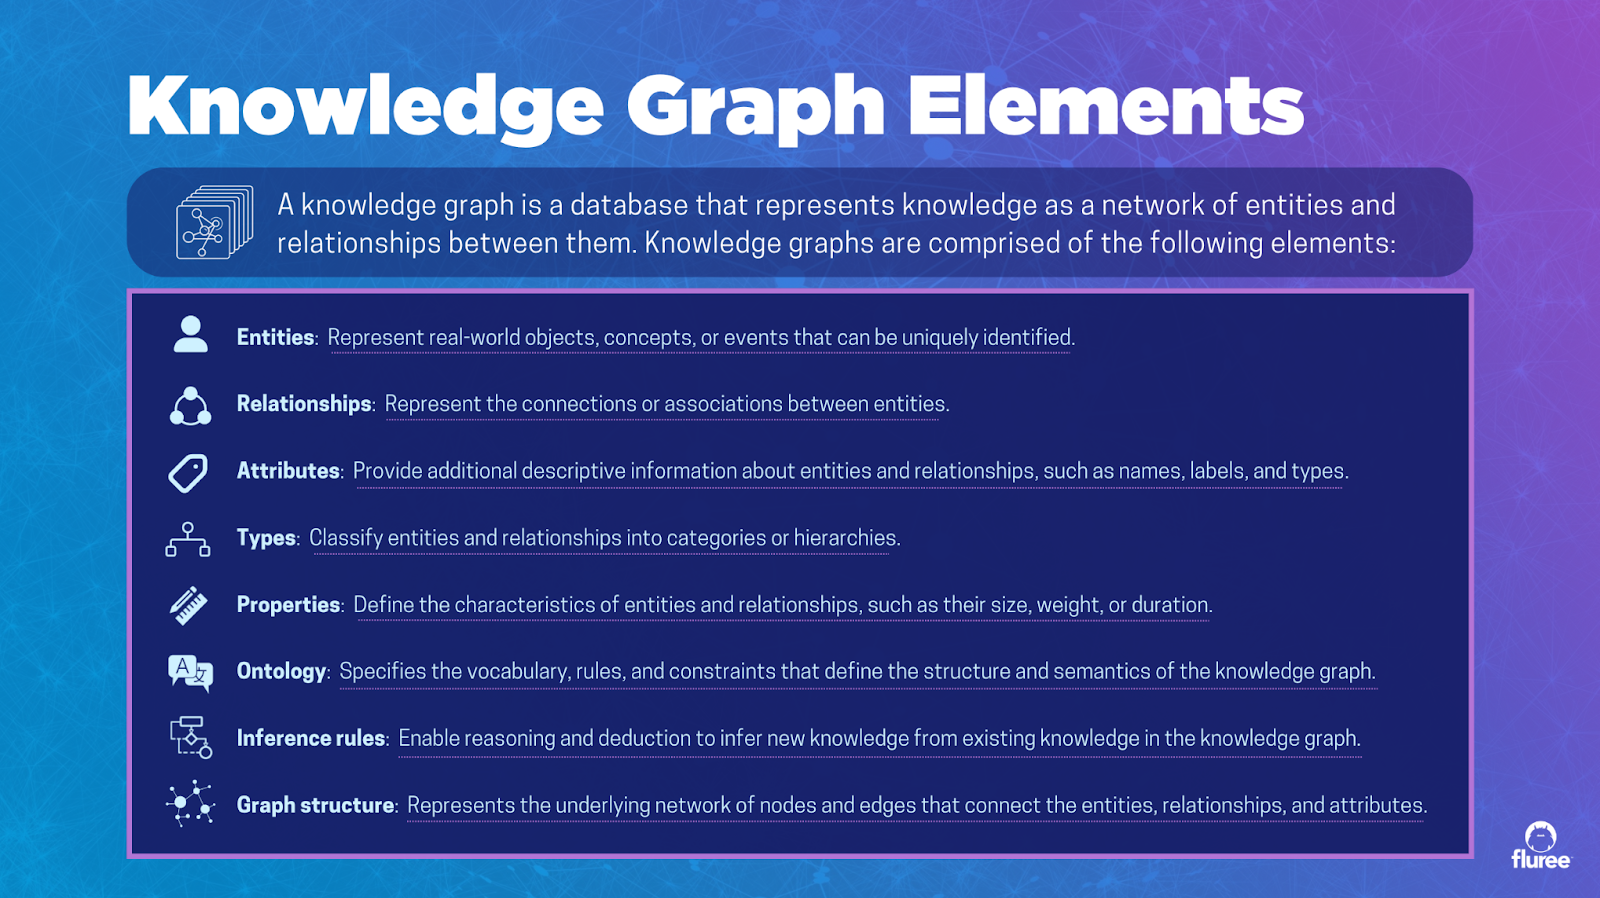
A knowledge graph is a database that represents knowledge as a network of entities and relationships between them. Knowledge graphs are comprised of the following elements:
- Entities: Represent real-world objects, concepts, or events that can be uniquely identified.
- Relationships: Represent the connections or associations between entities.
- Attributes: Provide additional descriptive information about entities and relationships, such as names, labels, and types.
- Types: Classify entities and relationships into categories or hierarchies.
- Properties: Define the characteristics of entities and relationships, such as their size, weight, or duration.
- Ontology: Specifies the vocabulary, rules, and constraints that define the structure and semantics of the knowledge graph.
- Inference rules: Enable reasoning and deduction to infer new knowledge from existing knowledge in the knowledge graph.
- Graph structure: Represents the underlying network of nodes and edges that connect the entities, relationships, and attributes in the knowledge graph.
Knowledge Graphs offer a powerful way to organize and connect data across an organization through the use of semantic standards and universal ontologies (read more on the Fluree Blog: Semantic Interoperability – exchanging data with meaning). Knowledge graph use cases are growing rapidly, as the need to connect and integrate disparate data sources grows everyday for organizations looking to play effective “data offense” and “data defense” simultaneously.
However, despite the many benefits of knowledge graphs, most enterprises are not yet ready for such an initiative, specifically due to poor, duplicated, and non-interoperable data. Those 300+ saas application silos are contributing to poor data quality, lack of interoperability, and lack of data governance.
Let’s dive into these challenges:
Challenge #1: Lack of Data Quality
One of the biggest challenges facing organizations looking to implement a knowledge graph is the quality of their existing data. In many cases, enterprise data is duplicated, incomplete, or simply not fit for purpose. This can lead to a range of problems, from difficulty in extracting insights from the data to confusion and errors when trying to make sense of it all. Poor data quality can be a major roadblock for any knowledge graph initiative, as it can make it difficult to build an accurate and comprehensive understanding of an organization’s data.
Challenge #2: Lack of Data Interoperability
Another challenge for knowledge graph implementation is the issue of interoperability. Most organizations have data stored in various formats and systems, making it difficult to connect the dots and derive meaningful insights from the data. In addition, many enterprises rely on proprietary software and data formats, which can make it even harder to integrate disparate data sources into a single knowledge graph. Without a standard way to connect all of their data sources, organizations are unable to build a comprehensive knowledge graph that reflects the true complexity of their business
Challenge #3: Lack of Data Governance
Lastly, many enterprises struggle with data governance and management, which can be a significant barrier to knowledge graph implementation. Data governance encompasses a wide range of practices and policies that are designed to ensure that data is managed effectively, from the way it is stored and secured to the way it is used and shared. Without robust data governance, organizations may be unable to ensure that their data is of sufficient quality and consistency to support a knowledge graph initiative. This can lead to a lack of trust in the data and make it difficult to build meaningful insights from it.
While knowledge graphs offer a powerful way to unlock the potential of enterprise data, most organizations are not yet ready for such an initiative. The challenges of poor, duplicated, and non-interoperable data, as well as data governance and management, pose significant barriers to implementation.
And – given the state of enterprise data management – the average data source is not quite ready for inclusion in a knowledge graph.
The Path Forward
Best Practices in Prepping Enterprise Data for Knowledge Graphs
Knowledge graphs provide a powerful way to capture, organize, and analyze information from various sources, enabling organizations to gain insights that were previously hidden or difficult to access. However, preparing legacy data for an enterprise knowledge graph can be a complex and challenging process. Let’s dive into the common steps needed to build an effective enterprise knowledge graph:
1 – Define the scope and goals of the knowledge graph project: The first step in preparing legacy data for an enterprise knowledge graph is to clearly define the scope and goals of the project. This involves identifying the data sources that will be included in the knowledge graph, the types of entities and relationships that will be represented, and the business use cases that the knowledge graph will support.
2 – Cleanse and standardize data: Before data can be added to a knowledge graph, it must be cleansed and standardized to ensure accuracy and consistency. This involves identifying and correcting errors, removing duplicate entries, and standardizing formats and values across different data sources.
3 – Transform data into a graph-friendly format: Once data has been cleansed and standardized, it must be transformed into a graph-friendly format. This involves mapping the data to a graph schema that defines the entities and relationships that will be represented in the knowledge graph. The schema should be designed to support the business use cases and goals of the project, and it should be flexible enough to accommodate changes and additions as the knowledge graph evolves over time.
4 – Map data to graph schema: After the schema has been defined, data must be mapped to the schema to create the knowledge graph. This involves identifying the entities and relationships in the data and creating nodes and edges in the graph that represent them. The process of mapping data to a graph schema can be automated to some extent, but it often requires human input and expertise to ensure that the resulting graph accurately reflects the data.
5 – Validate and refine the knowledge graph: Once the knowledge graph has been created, it must be validated and refined to ensure that it accurately represents the data and supports the business use cases of the project. This involves testing the graph against various scenarios and use cases, refining the schema and data mappings as needed, and incorporating feedback from stakeholders and users.
The Game-Changer: AI
Most data transformation projects are costly and time consuming – these same barriers exist for any knowledge graph initiative. While we certainly need to address the above challenges (data cleanliness, interoperability, structure, and standardization), the data engineering required can bring quite the pricetag.
Fluree Sense automates these processes: using machine learning and AI to find patterns inherent in data to help map data across multiple ontologies, Fluree Sense transforms data silos into structured, semantic data assets that are optimized for Knowledge Graph. With Fluree Sense, you can automatically transform your legacy data into a format that is compatible with your enterprise knowledge graph.
The Fluree Sense Process
-
Ingest and Classify - Fluree Sense uses its Classify module to allow users to import and load multiple business information models, glossaries, data dictionaries, source schemas, ontologies and target models into one inventory. Classify quickly and accurately scans entire data sources and maps all columns for all data sets to any of the corresponding business terms from across all ontologies or data models loaded.
Fluree Sense Classify’s language learning models are further reinforced through expert feedback and supervised learning. This enables Classify’s capability to quickly and accurately scan entire data sources and map all columns for all data sets to any of the corresponding business terms from across all ontologies or data models loaded. Classify’s user interface is designed for data users and business people, and not necessarily for developers and programmers.
Classify also helps discover synonym relationships across multiple ontologies based on identified patterns, which helps identify further new data relationships and mapping predictions in a virtuous cycle.
-
Transform - When the models have been fully trained, Fluree Sense will automatically convert flattened data (typically in the form of spreadsheets, delimited text files, or database tables) into an RDF-friendly technical data format called JSON-LD, which enables you to not only map the semantic relationships to data, but also save the data in RDF-friendly data store and Knowledge Graphs.
-
Load - Finally, Fluree Sense will load and register the JSON-LD converted data onto your knowledge graph platform. Fluree Core, our knowledge graph database, allows organizations to host, consume, and share interoperable knowledge graph data. Fluree Core enables end-users to browse data from multiple parties, query the data using the semantic ontologies, and facilitate security and access control through implementation of robust data entitlement and sharing policies.
The End Result
By using Fluree Sense to prepare your legacy data for an enterprise knowledge graph, you can streamline the data preparation process and ensure that your knowledge graph is built on a solid foundation of reliable and accurate data. Data is now semantically described in multiple ontologies, and can therefore be accessed by many users within and outside a company’s four walls based on whichever vocabulary they are comfortable interacting in. Data is also saved in RDF-friendly form so that it can be loaded into KnowledgeGraphs which enable users to analyze and introspect the data using queries more powerful than traditional SQL database queries alone.
With Fluree Sense, you get best-in-class data cleansing technology that is business user-friendly.
-
Improved Data Quality - Fluree Sense ensures that your data is of the highest quality before it is ingested into your enterprise knowledge graph. This includes removing duplicates, correcting errors, and standardizing values to ensure consistency.
-
Automatic Data Classification - Fluree Sense automatically classifies your data based on its content, making it easier to map to your enterprise knowledge graph schema. This saves time and reduces the risk of errors during the data mapping process.
-
Customizable Data Remediation Rules - Fluree Sense allows you to define custom data remediation rules to ensure that your data is transformed according to your organization’s specific needs and requirements.
Is Data Cleansing the Answer to my Data Problems?
A thousand times, no. Data Cleansing is a great way to get enterprise data into a usable state, but it does not address the fundamental problem that enterprises must address: their source data is, by nature, siloed.
The ideal scenario is that the necessity for data cleansing diminishes over time, as the underlying reasons for data problems are addressed. Without tackling the fundamental issues of native interoperability, semantics, trust, quality, and security, we will only be applying temporary fixes to a convoluted and deeply ingrained architectural problem.
We cover the fundamentals of addressing each of these “data problems” in our data-centric architecture series. Read it here.
Stay in the loop
Weekly insights on enterprise AI, knowledge graphs, and data intelligence.