Introducing Business Intelligence Without the BI Software
If we have data and AI, do we need BI software?
For all of its advanced capabilities and $30 billion market size, business intelligence (BI) still doesn’t get used much by companies with less than 5,000 people. Indeed, half of BI’s user base consists of enterprises with more than $5B in annual revenue, whose vast volume of data demands centralized services.
Mid-market companies are also rife with data silos. Many, however, suspect the gains promised by BI simply aren’t worth the investment.
The hunch is correct. To be blunt, if anyone is thinking about buying a BI tool today—don’t. We’re not admonishing you to stick with older, slower ways of centralizing data. Instead, you can now leapfrog legacy BI, generate dashboards on demand, and query your data—for a fraction of the traditional BI costs, and without the lag time. On-demand BI, it turns out, doesn’t require BI software at all. Just a better data architecture.
Good idea, slow execution
The premises for using BI are sound. BI can query data that is otherwise siloed across departments. Analysts prepare data and manually create dashboards upon request. These dashboards give leaders visual insight into the reality of the business, helping to answer strategic questions. Whenever more questions arise, staff are at the ready to create more dashboards.
This combination of human labor and BI software can cost into the tens of millions. Whenever a leader requests a dashboard, a chain of activities launch into motion so that she eventually gets her result. Inconsistent data, poor real-time processing, and cumbersome extract-transform-load (ETL) processes mean that teams must cook up every dashboard from scratch.
This time lag discourages leaders from querying data for ongoing, intelligent answers. The business question that seemed urgent when first asked has sometimes been answered—or become irrelevant—by the time the dashboard finally goes live.
Vendors are attempting to bridge the gap by applying generative AI (genAI) to BI instances. GenAI, however, is notorious for limited utility and hallucinations. The most common approach—converting documents and data into vector embeddings and then predicting answers based on mathematical similarity —sounds logical, but vector similarity isn’t the same as semantic accuracy. The system finds text that looks similar, but it can’t understand the relationships, context, or metadata that make that information meaningful. (We’ve covered this in depth in a previous blog post.) It’s putting lipstick on a pig rather than solving the real problem.
BI dashboards without the BI software
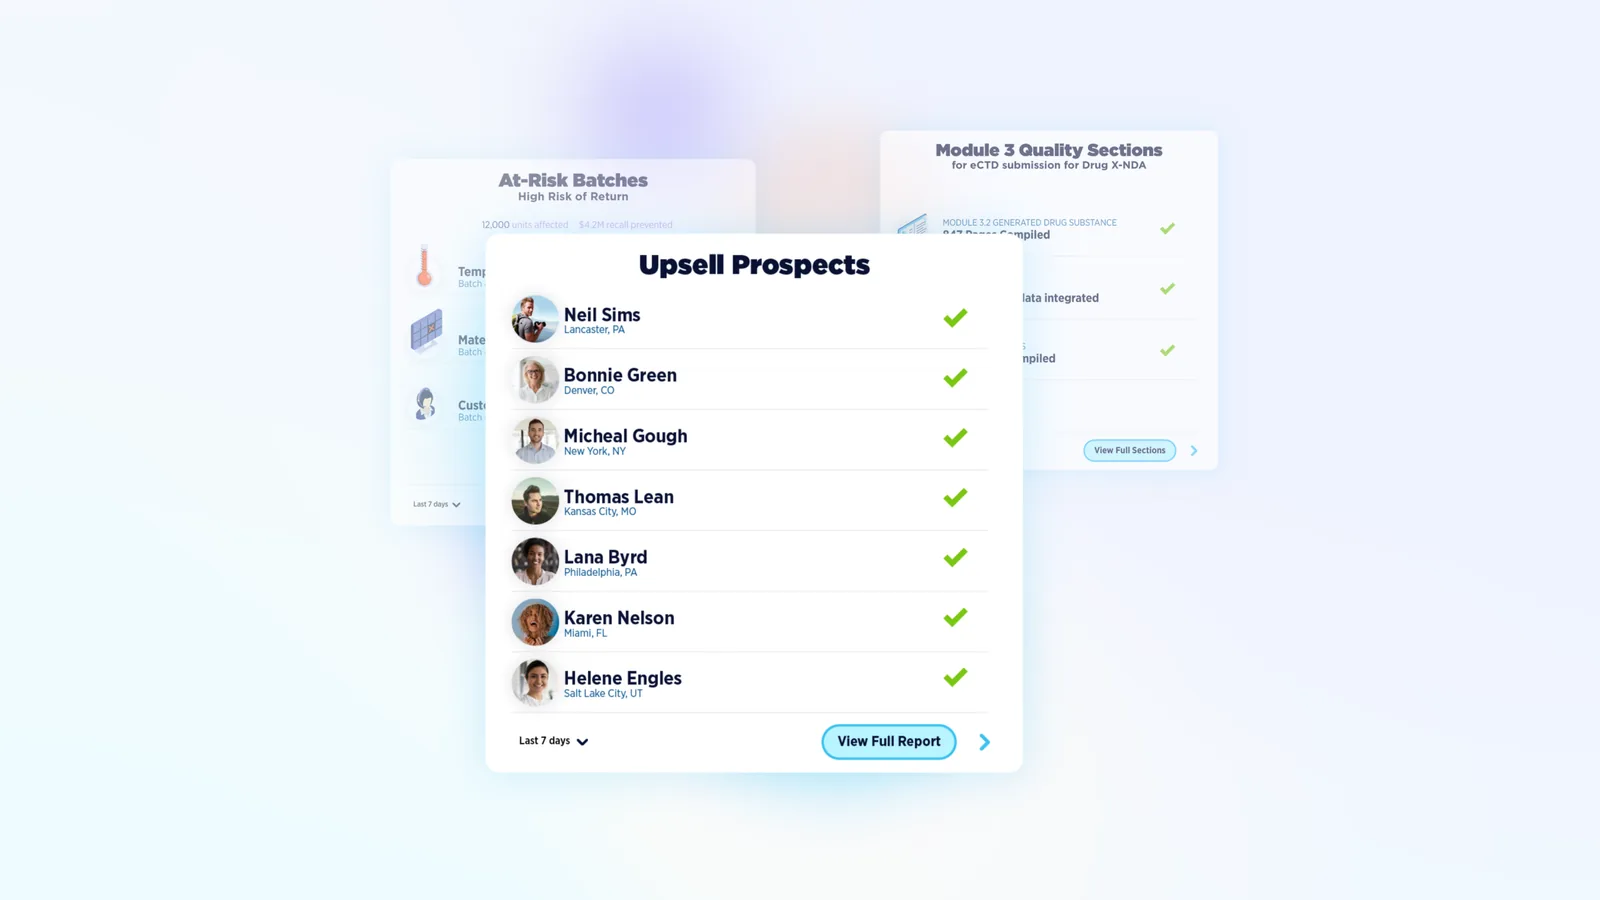
Here at Fluree, we’ve figured out a way for you to stand up BI dashboards on demand. As long as your data is integrated under a common ontology and governance, you can request ad hoc analytics and receive immediate, verifiable answers from your own data.
Your only job is to ask questions in natural language and receive a real-time answer. GenAI generates visualizations, charts, and analysis on demand—but only after querying verified data from your systems. Because you can trust the underlying data, anyone can query it and find answers. No need to wait for a team to create a dashboard; no waiting for answers.
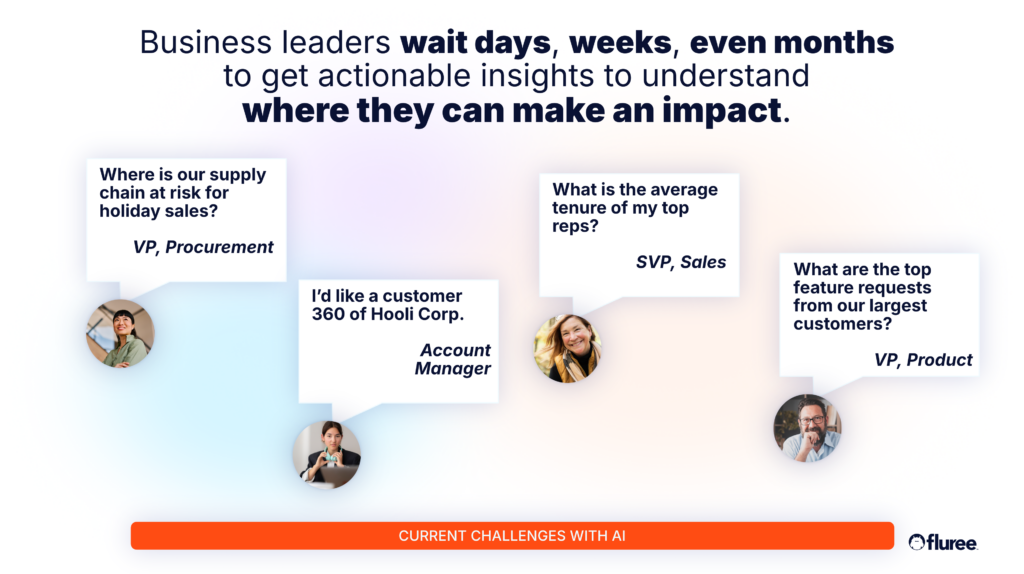
Ask Anything: What Questions Do You Need Answered?
Fluree’s approach works across industries. Here’s how four different teams ask high-stakes questions and get real answers from the same semantic knowledge graph — no pre-built dashboards required.
Frequently Asked Questions
Here’s how it works under the hood.
-
Fluree Sense automatically converts data from silos (Oracle, SAP, SQL, etc.) into a unified semantic knowledge graph.
-
Fluree CAM auto-tags unstructured content (PDFs, documents, etc.), eliminating massive amounts of manual ETL and data prep work.
-
Semantic reconciliation automatically happens through the ontology, no manual mapping required. For example, the system will automatically recognize that "client" in finance = "customer" in marketing = "account" in sales.
Fluree only applies genAI after querying your data, so every data point in your analysis comes from a real record, not an approximation. Only after pulling verified data does generative AI add context. This is the fundamental difference between Fluree’s approach and vector-based AI: instead of predicting answers from statistical similarity, Fluree retrieves precise data from your knowledge graph and then uses AI to contextualize and present it.
Say you ask for an order-to-cash optimization dashboard. Traditional BI would show current receivables, invoice categories, and customer segments. A vector-based AI might add "interesting patterns" it detected through statistical similarity—but you’d have no way to verify whether those patterns reflect reality or are artifacts of the embedding model. Fluree would pull actual data from your databases, generate an interactive dashboard, and then layer on actionable insights, for example: "Prioritize these receivables based on payment history," or "This customer segment shows 23% higher credit risk than your policies account for."
With vector embeddings, users rightfully ask: "How do I know this is accurate?" With query-driven intelligence, every insight traces to specific data points from verified sources. You can drill from a recommendation to the exact records supporting it—and Fluree can describe its entire analytical process, linking to the databases it queried so you can independently retrace every step. This matters for real-time use cases, and is critical in regulated industries where you need to justify decisions with full data lineage.
Use cases
Because all data lives in a unified semantic knowledge graph, Fluree treats each source as a queryable endpoint. You can add new data streams by defining schemas within your ontology—Fluree Sense and CAM handle the ingestion and classification automatically, rather than requiring custom-built APIs and ETL pipelines for every new source. Analyzing and querying diverse data sources becomes dramatically easier. Indeed, we get closer to the self-service model promised, but never delivered, by traditional BI.
Social media risk monitoring: Deploy AI-assisted dashboards for teams handling customer feedback across social platforms, review sites, and support channels. Configure automated categorization and escalation rules that trigger based on specific risk indicators. Measure reduction in response time and quality issue detection rates.
Order-to-cash optimization: Build intelligence layers that analyze accounts receivable aging, customer payment patterns, and credit risk indicators. Configure the system to recommend prioritization strategies that maximize cash collection efficiency. Track improvements in days sales outstanding and collection rates.
Supplier performance analysis: Integrate procurement, quality control, and delivery data into unified dashboards that surface supplier reliability patterns. Enable teams to identify performance degradation before it impacts production. Measure reduction in supply chain disruptions and inventory carrying costs.
An opportunity for midsized enterprises
If the BI industry wants to grow, incumbents face the innovator’s dilemma: they must preserve legacy revenue streams while adopting new architectures. Fluree has built the new architecture—a semantic knowledge graph with embedded security, real-time querying, and AI that explains its work—enabling large-enterprise-grade intelligence for mid-market companies.
After all, the organizations that will thrive in the next decade aren’t those with the most data or the biggest BI budgets. They’re the ones that can consistently convert questions into actions faster than their competitors—with confidence that those actions rest on verified insights rather than algorithmic suggestions. That capability doesn’t come from better dashboards. It comes from intelligence architectures designed for action, not just analysis.
Stay in the loop
Weekly insights on enterprise AI, knowledge graphs, and data intelligence.